Main Menu > Warehouse Management > Reports (F&B) > Food Costing
Food Costing report is based on Sales and Stock Journal entries. In example below, 20 glasses of Lassi was produced and 5 glasses of Lassi were sold.
When you further expand this report, it will display ingredient’s quantity and cost information as defined in recipe.
There are two methods of viewing food costing i.e., based on Total Sales and based on Cost of Goods Sold (COGS).

Buttons in the Food Costing Report:
Buttons are explained in Using Reports (Register). Buttons specific to “Food Costing Report” are discussed here:
-S COGS |
Show report as per Cost of Goods Sold. Calculating formula for Food Cost = {(Sales Qty) * (Cost per Item)} * 100 / Sales Value. |
-T Total Cost |
Show report as per Cost of Total Goods both sold and unsold. Calculating formula for Food Cost = Total Cost * 100 / Sales Value. |
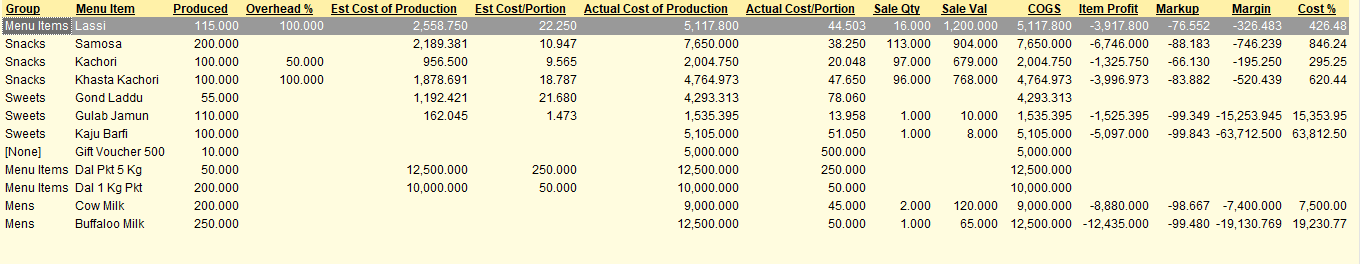
Enhancement in Food Costing Report (W>F>F)
●Renamed Columns
○Cost of Production > Actual Cost of Production
○Cost/Portion > Actual Cost/Portion
●Added new columns in the default view
○Estimated Cost of Production
○Estimated Cost/Portion
●Added new columns in the product detail view
○Var Qty
○Var Amount
●
Enhancement in Report
Added two buttons in Food Costing Report.
●Day Wise (ALT+D): It will show Location cum group cum date wise food cost report for the specified date range.
●Location wise (ALT+L): It will show location wise food cost report. From this report you can compare food cost of a product for different locations.