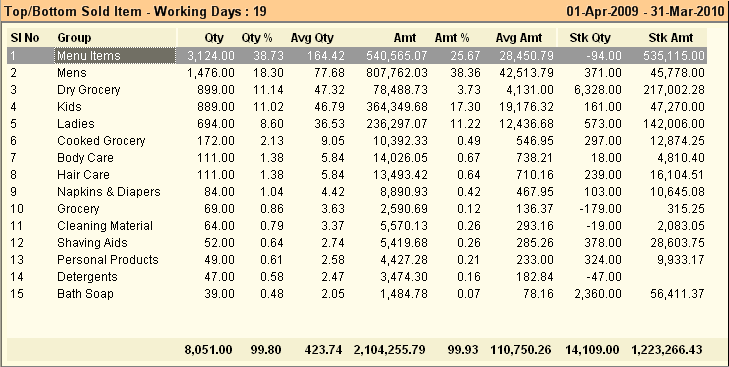
Main Menu > Sale Management > Analysis Tools > Top Sold Items
Displays list of Top Sales items showing Items with quantity and value along with percentage to total sales for the period specified. These Items constitute the major Sales and require very planning, attention and inventory control.
You may get the report of lowest sale Items by clicking the Bottom button.

Columns in the Top Sold Items are as follows:
Qty
|
Sale quantity for the given date range.
|
Qty %
|
% of item quantity in total Sale quantity (Qty x 100 / Total Quantity).
|
Avg Qty
|
Qty / Number of Days in the given date range.
|
Amt
|
Sale amount for the given date range.
|
Amt %
|
% of item amount in total Sale amount (Amt x 100 / Total Amount).
|
Avg Amt
|
Amt / Number of Days in the given date range.
|
Stk Qty
|
Closing stock quantity for the given date range.
|
Stk Amt
|
Closing stock amount for the given date range.
|
Curr Stk Qty
|
Shows the stock quantity as on current date.
E.g. If we see a report on date 10/05/2011 & the Reporting period is 01/04/2011 to 30/04/2011 then shows Closing Stock up to 30/04/2011 & Current Stock up to 10/05/2011.
|
Curr Stk Amt
|
Shows the stock amount as on current date.
E.g. If we see a report on date 10/05/2011 & the Reporting period is 01/04/2011 to 30/04/2011 then shows Closing Stock Amount up to 30/04/2011 & Current Stock up to 10/05/2011.
|
Profit
|
Shows profit amount.
|
Margin
|
Shows markup % = [(MRP - P Cost)/ P Cost] x 100).
|
|
Buttons in the Top Sold Items:
Buttons in Top Sold Items are explained in Using Reports (Register) and Top Purchase Items.


