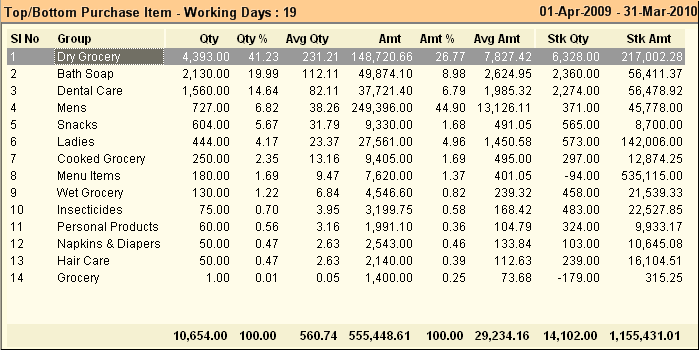
Main Menu> Purchase Management > Analysis Tools > Top Purchase Items
Displays list of Top purchased items (normally A Class Items) showing Items with quantity and value along with percentage to total purchase for the period specified.
These Items constitute the major value of Purchases and require very close controls.

Columns in the Top Purchase Items are as follows:
Qty
|
Purchase quantity for the given date range.
|
Qty %
|
% of item quantity in total purchase quantity (Qty x 100 / Total Quantity).
|
Avg Qty
|
Qty / Number of Days in the given date range.
|
Amt
|
Purchase amount for the given date range.
|
Amt %
|
% of item amount in total purchase amount (Amt x 100 / Total Amount).
|
Avg Amt
|
Amt / Number of Days in the given date range.
|
Stk Qty
|
Closing stock quantity for the given date range.
|
Stk Amt
|
Closing stock amount for the given date range.
|
Curr Stk Qty
|
Shows the stock quantity as on current date.
E.g. If we see a report on date 10/05/2011 & the Reporting period is 01/04/2011 to 30/04/2011 then shows Closing Stock up to 30/04/2011 & Current Stock up to 10/05/2011.
|
Curr Stk Amt
|
Shows the stock amount as on current date.
E.g. If we see a report on date 10/05/2011 & the Reporting period is 01/04/2011 to 30/04/2011 then shows Closing Stock Amount up to 30/04/2011 & Current Stock up to 10/05/2011.
|
|
Buttons in Top Purchase Items are explained in Using Reports (Register). Buttons specific to the report are discussed here:
 
-L Select Option
|
Click –L Select Option button or press ALT + L and select any one option from type list, (like-Brand, Department, Group, Product, Sub Group, Supplier, Matrix List etc.) to show the report of selected option wise
|
-Q Quantity
|
Click –Q Quantity button or press ALT + Q to show the report in descending order wise quantity
|
-A Amount
|
Click –A Amount button or press ALT + A to show the report in descending order wise Amount
|
^T Top
|
Click ^T Top button or press CTRL + T to show the report in high level to low level
|
^B Bottom
|
Click ^B Bottom button or press CTRL + B to show the report in low level to high level
|
-N Number
|
Click –N Number or press ALT + N to show the report until a particular number. (For example, 14 types of group in the report but you want to show 10 types of report, then you click ALT + N and you get a Enter Number Field, where you put can put your number like –10)
|
|


