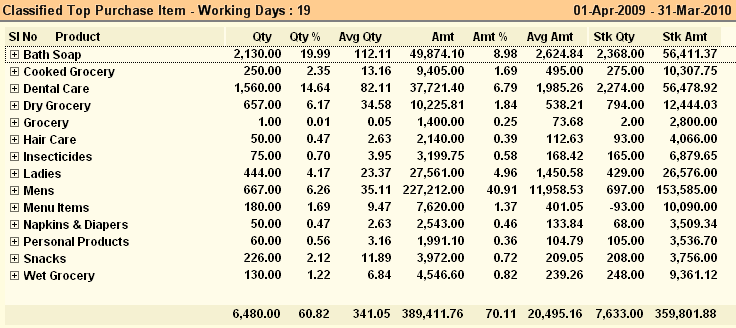
Main Menu> Purchase Management > Analysis Tools > Classified Top Purchase
This report shows the top categories of Items according to Purchase Value, showing the percentage of total purchases and stock for each Category.
Helpful at season period / festive occasion to decide the Item Categories for Purchase.

Columns in the Classified Top Purchase as as follows:
Qty
|
Purchase quantity for the given date range.
|
Qty %
|
% of item quantity in total purchase quantity (Qty x 100 / Total Quantity).
|
Avg Qty
|
Qty / Number of Days in the given date range.
|
Amt
|
Purchase amount for the given date range.
|
Amt %
|
% of item amount in total purchase amount (Amt x 100 / Total Amount).
|
Avg Amt
|
Amt / Number of Days in the given date range.
|
Stk Qty
|
Closing stock quantity for the given date range.
|
Stk Amt
|
Closing stock amount for the given date range.
|
Curr Stk Qty
|
Shows the stock quantity as on current date.
E.g. If we see a report on date 10/05/2011 & the Reporting period is 01/04/2011 to 30/04/2011 then shows Closing Stock up to 30/04/2011 & Current Stock up to 10/05/2011.
|
Curr Stk Amt
|
Shows the stock amount as on current date.
E.g. If we see a report on date 10/05/2011 & the Reporting period is 01/04/2011 to 30/04/2011 then shows Closing Stock Amount up to 30/04/2011 & Current Stock up to 10/05/2011.
|
|
Buttons in the Classified Top Purchase:
Buttons in Classified Top Purchase are explained in Using Reports (Register) and Top Purchase Items.


