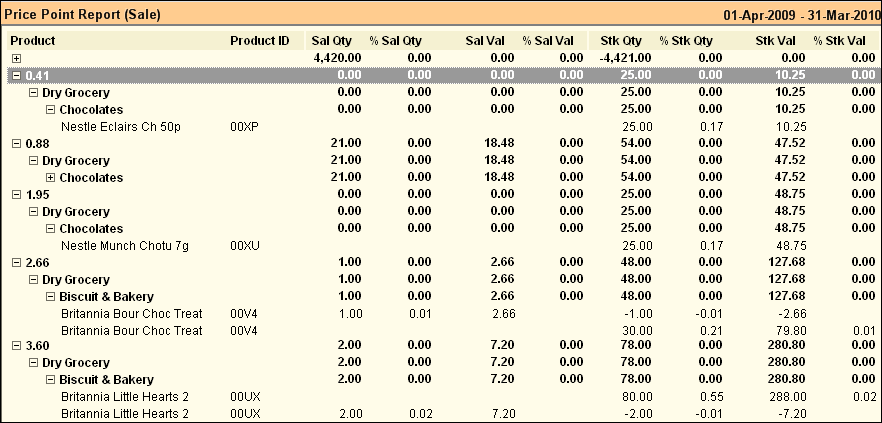
Main Menu> Warehouse Management > Analysis Tools > Price Points Report
Helps you to facilitate buying process by displaying stock items in different price points.
•Helps you to manage crowd during peak hours by offering them products on specified budget.
•Displays list of items in different price points in Purchase, Sale and Stock view with quantity, value, balance stock and contribution percentage
•You may choose to view only Purchase or Sale or Purchase, Sale and Stock all together.
Columns in the Price Point Report are as follows:
Product
|
Shows name of the product.
|
Product ID
|
Shows four digit product code.
|
Pur Qty
|
Shows purchase quantity.
|
% Pur Qty
|
Shows % in total purchase quantity.
|
Pur Val
|
Shows purchase value.
|
% Pur Val
|
Shows % in total purchase value.
|
Sal Qty
|
Shows sale quantity.
|
% Sal Qty
|
Shows % in total sale quantity.
|
Sal Val
|
Shows sale value.
|
% Sal Val
|
Shows % in total sale value.
|
Stk Qty
|
Shows Stock quantity.
|
% Stk Qty
|
Shows % in total stock quantity.
|
Stk Val
|
Shows stock value.
|
% Stk Val
|
Shows % in total stock quantity.
|
|
Buttons in Price Point Report are explained in Using Reports (Register). Buttons specific to the report are discussed here:
-P Purchase
|
Show price point analysis of Purchase Items.
|
-S Sale
|
Show price point analysis of Sale Items.
|
-I Stock
|
Show price point analysis of Available Stock Items.
|
|


