Main > Property Management > Report > Night Audit Report
Night Audit Report is prepared for managerial use, which help the management to review the profitability of the hotel operations and plan future goals.
It is the combination of following Reports:
House Status is explained below:
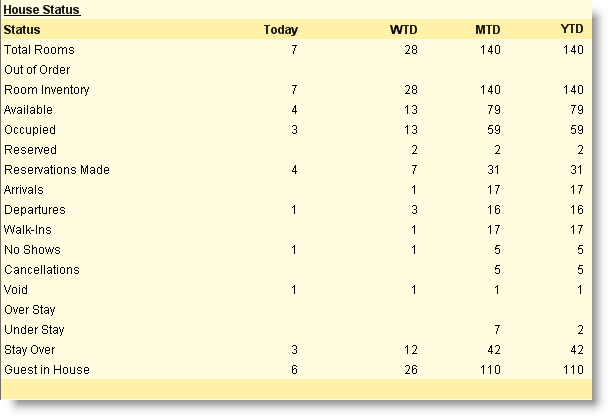
Total Rooms
|
Total number of rooms in the hotel.
|
Out of Order
|
Number of rooms that are blocked for use. Hoteliers generally use to keep the room Out of Order which is currently under construction or maintenance. Check-in is not allowed if the room is out of order. In order to block or unblock a room please refer to the buttons "-U Block" and "^U Unblock" in the Room Status.
|
Room Inventory
|
Total Room - Room Out of Order = Inventory, for the day.
|
Available
|
Total Rooms excluding the Rooms Out of Order for the day.
|
Occupied
|
Number of checked-in rooms for the day.
|
Reserved
|
Number of reserved rooms available to be checked-in for the day.
|
Reservation Made
|
Total number of reservations made for the day.
|
Arrivals
|
Total number of rooms Checked-in for the day.
|
Departures
|
Total number of rooms Checked-out for the day.
|
Walk-Ins
|
Number of walk-ins for the day.
Walk-ins = Rooms booked and checked-in on the same day.
|
No Show
|
Number of rooms for which No Show has been transacted for the day.
|
Cancellations
|
Number of rooms for which Cancel Booking has been transacted for the day.
|
Void
|
Number of rooms for which Void entry has been transacted for the day.
|
Over Stay
|
Number of rooms for which Extend Stay has been transacted for the day.
|
Under Stay
|
Number of rooms for which Early Check-out has been transacted for the day.
|
Stay Over
|
Number of rooms which are still occupied i.e. not scheduled to check-out on the day and will be used for at least one more day.
|
Guest in Hose
|
Total number of guests which includes Adults and Children for the day.
|
WTD
Week-to-Date
|
Week Turnover Detail. E.g. For date range from 01-05-12 to 17-08-12, WTD data will be calculated for the period from 13-08-2012 to 17-08-2012.
|
MTD
Month-to-Date
|
Month Turnover Detail. E.g. For date range from 01-05-12 to 17-08-12, MTD data will be calculated for the month of August.
|
YTD
Year-to-Date
|
Year Turnover Detail. E.g. For date range from 01-05-12 to 17-08-12, YTD data will be calculated for the period from 01-04--2012 to 17-08-2012 if FY start date is 1st April.
|
|
House Keeping Status is explained below:
Opening
|
Opening Cash Balance.
|
Room Receipt
|
Total cash received from the sale of rooms.
|
Other Receipt
|
Total cash received from POS sale, Room Service, misc. receipts etc.
|
Other Payment
|
Cash payment for purchase or other expenses.
|
Closing
|
Total closing cash balance as per system.
|
Actual
|
Total closing cash balance as per operator after manual count.
|
Difference
|
Difference between Actual Cash and Closing Cash balance.
|
|
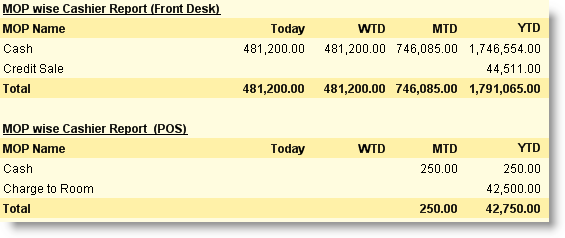
MOP Wise Cashier Report (Front Desk) is explained below:
Cash
|
Total Cash Sale.
|
Credit Sale
|
Total sales by Credit Card.
|
Charge to Room
|
Total sales to Hotel Guests.
|
|
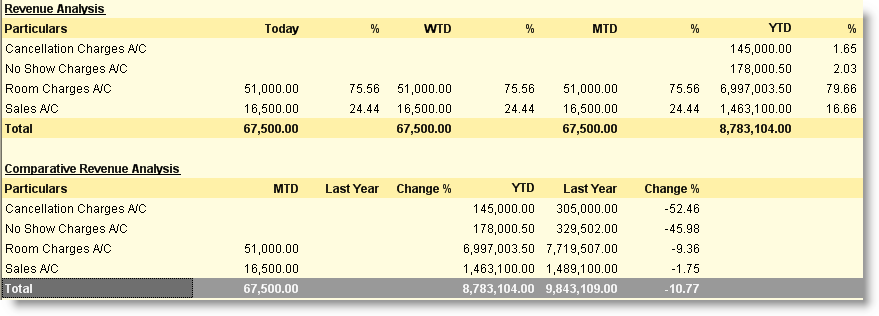
Revenue Analysis: Compare Current Date data with WTD, MTD and YTD along with % changes in business.
Comparative Revenue Analysis: Compare MTD and YTD data with Last Financial Years data along with % changes in business.
|
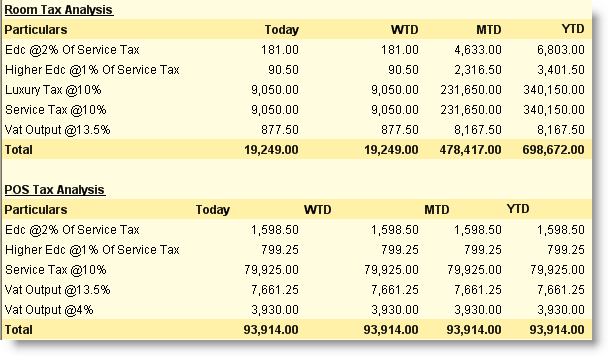
Room Tax Analysis report is explained below:
|
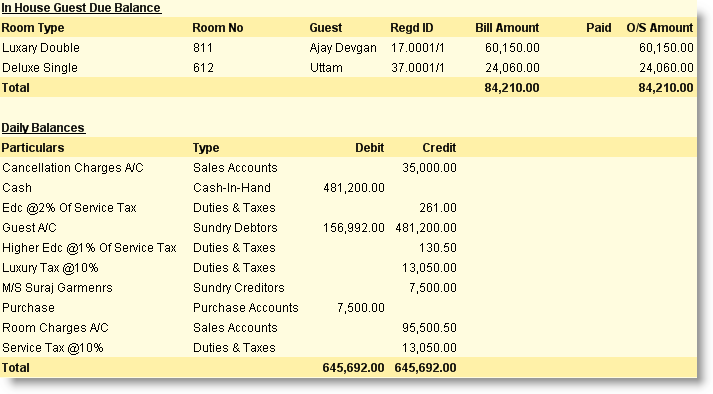
In House Guest Due Balance report is explained below:
O/S Amount
|
Total Outstanding Amount for the day.
|
|
Performance Analysis report is explained below:

Occupancy %
|
It shows occupancy rate in % for the day or a given date range.
Calculating Formula:
Room Sold * 100 / Total number of rooms exclude the rooms which are out of order.
Note:
It reveals the success of a hotel in attracting guests to a hotel. While higher rate shows success in attracting the customers, lower rate shows an inability in attracting.
|
Average Daily Rate (ADR)
|
It shows the Average Daily Rate for a day or given date range.
Calculating Formula:
Total Room Revenue includes Inclusions / Room Sold for a day.
Note:
It is one of the most common financial indicators to measure how well a hotel performs compared to its competitors and itself (year after year). Gradual increase in ADR year after year brings in more revenue.
|
Rev-Par
|
It shows the Revenue Par Available Room for a day or a given date range.
Calculating Formula:
Occupancy % * ADR
or Total Revenue / Total Room
Note:
It is one of the most common financial indicators used in hotel industries to make comparison between hotels of the same type. It reveals how much more or less rate a hotel is charging compared to its competitors.
|
Average Rate Par Guest (ARG)
|
Hoteliers should consider not only the revenue generated by each room (RevPaR), but also the revenue generated by each guest, from booking to check out.
This may include additional revenue generated by dining, recreation (golf, spa services, excursions and so on) and meeting facilities.
Average Rate Par Guest (ARG) is often considered by a hotel when conducting their revenue management.
Calculating Formula:
Total Room Revenue / Number of Guests
|
|
10 Days Forecast report is explained below:
Expected Occupancy
|
Shows total rooms occupied for the day.
|
Expected Occupancy %
|
Shows occupancy % for the day.
|
Expected Revenue
|
Shows total revenue for the day.
|
Expected ADR
|
Shows Average Daily Rate for the day.
|
Expected Rev-Par
|
Shows Revenue Per Available Room for the day.
|
|


