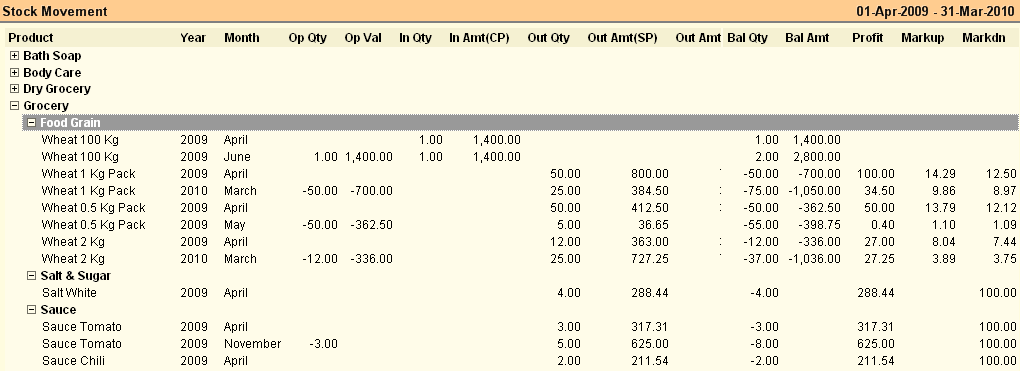
Main Menu> Warehouse Management > Analysis Tools > Stock Movement
This report shows month wise break up in respect of Opening, Stock In, Stock Out & Closing Stock, along with Profit, Mark Up & Mark Down analysis.
In collapse mode, the report shows the figures at Stock Group level, while in expand mode, item wise details are shown.
You may explode any Group to see the Item details of the specific Group.
Columns in the Stock Movement are as follows:
Op Qty
|
Shows Opening Stock Quantity.
|
Op Val
|
Shows value of the Opening Stock.
|
In Qty
|
Shows inward stock quantity.
|
In Amt (CP)
|
Shows inward stock amount in cost price.
|
In Amt (SP)
|
Shows inward stock amount in sale price.
|
Out Qty
|
Shows outward stock quantity.
|
Out Amt (SP)
|
Shows outward stock amount in sale price.
|
Out Amt (CP)
|
Shows outward stock amount in cost price.
|
Bal Qty
|
Shows balance stock quantity (Op Qty + In Qty) - Out Qty.
|
Bal Amt
|
Shows balance stock amount {Op Val + In Amt (CP)} - Out Amt (CP).
|
Profit
|
Shows profit amount.
|
Markup
|
Shows markup % = [(Sale Price - Cost Price) / Cost Price] x 100).
|
Margin
|
Shows margin % = [(Sale Price - Cost Price) / Sale Price)] x 100.
|
|
Buttons in the Stock Movement Report:
Buttons in Stock Movement are explained in Using Reports (Register).


