MIS
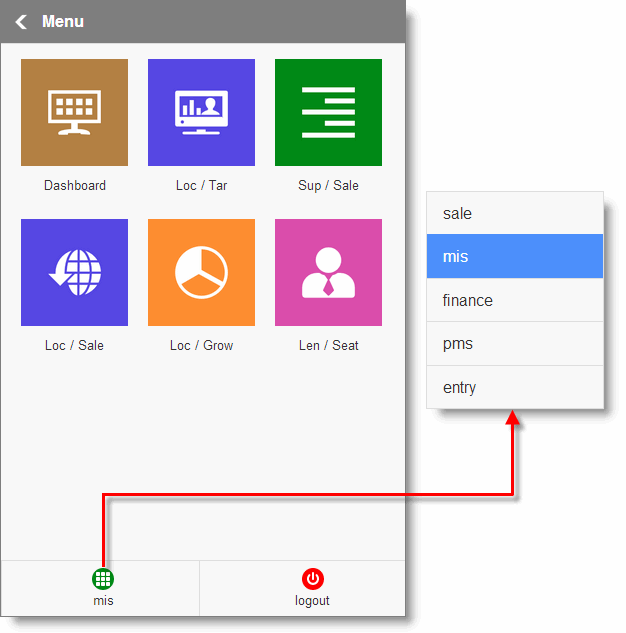
In this module you can see various graphical analysis reports.

•Dashboard: Key Performance Indicators (KPI) of all location on a single screen. It shows Sale, Purchase, Stock in Dashboard.
•Loc / Tar: Shows Location wise Target vs Achievement report for current / last month.
•Sup / Sale: Shows location wise top five suppliers for current / last month.
•Loc / Sale: Shows location wise sale report for current / last month.
•Loc / Grow: Location wise growth report.
•Len / Seat: Shows Length of Seating report for current day / current month / last day / last month.